National Maritime Museum
Passing Ships, National Maritime Museum
In my work I create what I call ‘data collection experiences’ for communities that offer participants space for self-reflection and the chance to look more closely at their thoughts about a particular topic through data collection.
I started creating these experiences when I was the artist-in-residence at the National Maritime Museum in Greenwich, London.
While settling into the residency, I became fascinated by the collection of Royal Navy ships’ badges that were on the walls around my studio door. Often witty and playful in their imagery, these Royal Navy ships badges function as the visual identity of a ship akin to a traditional coat of arms.
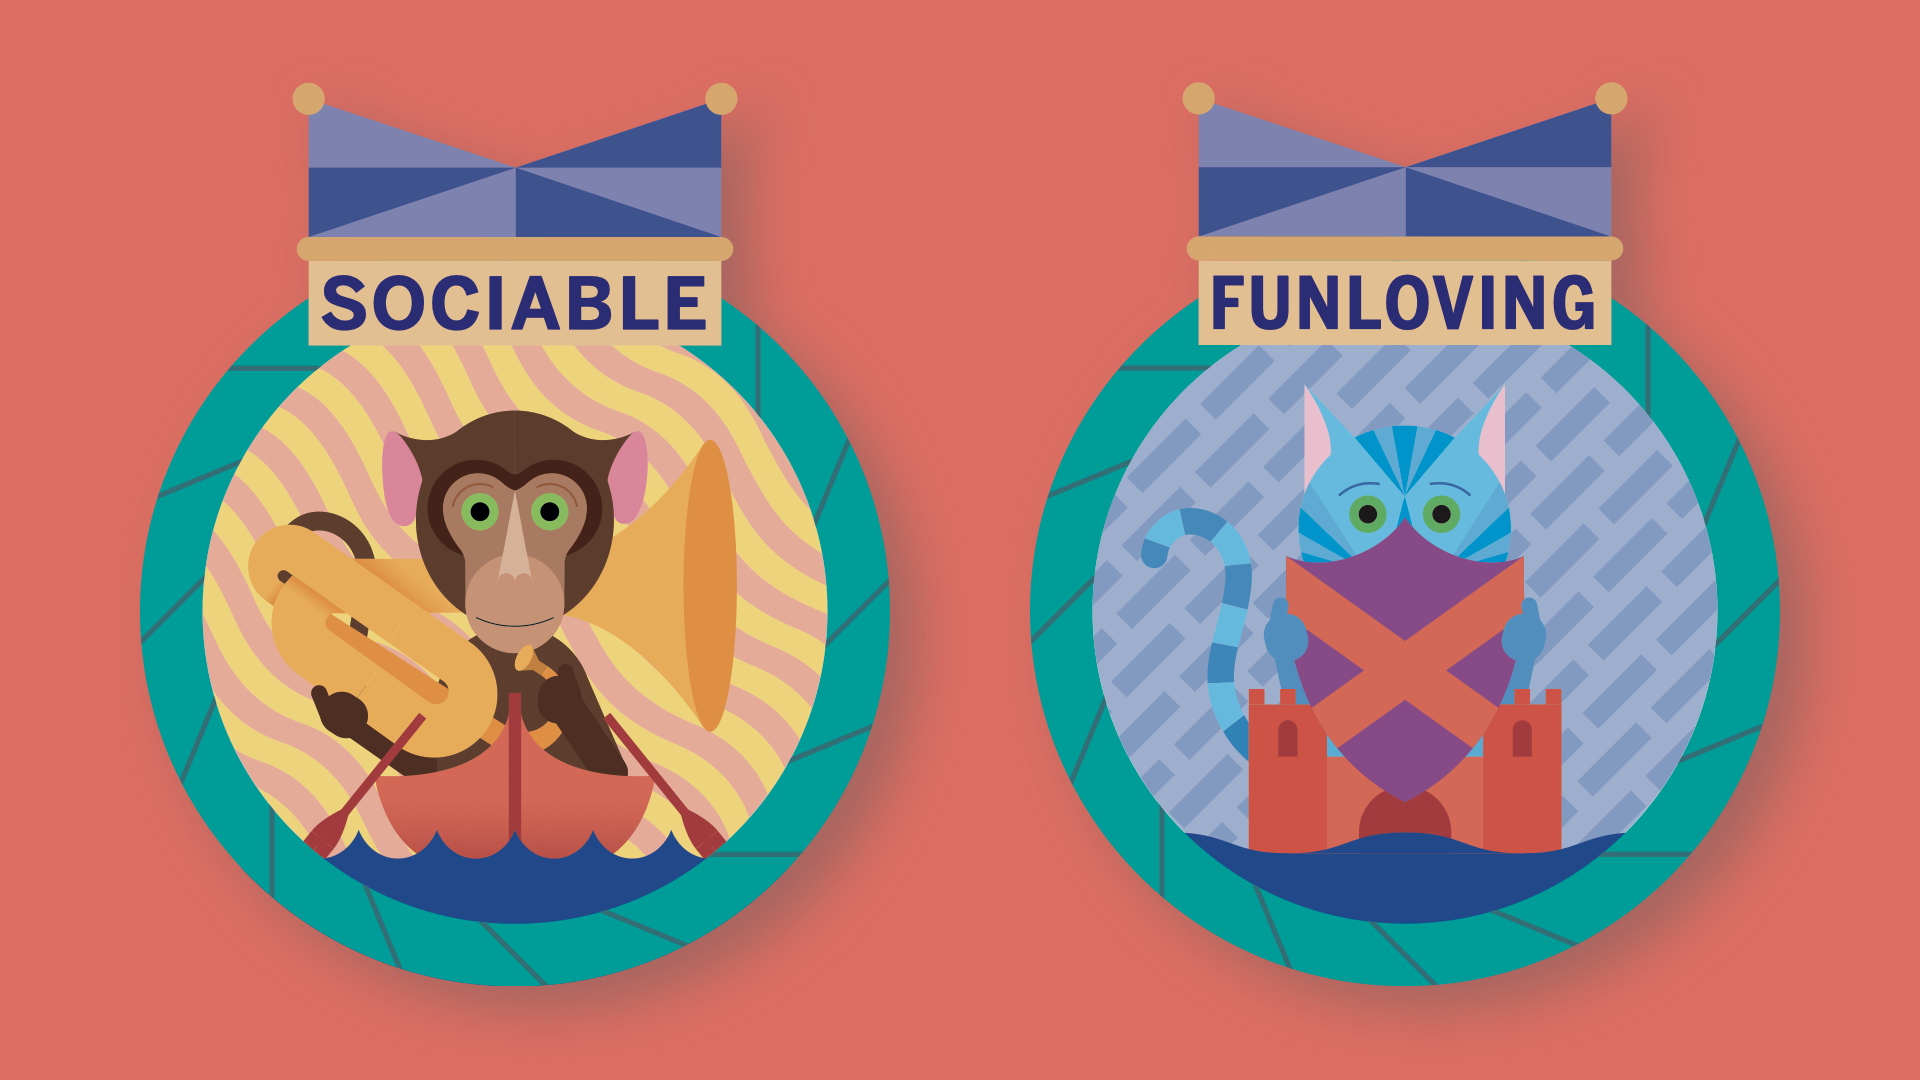
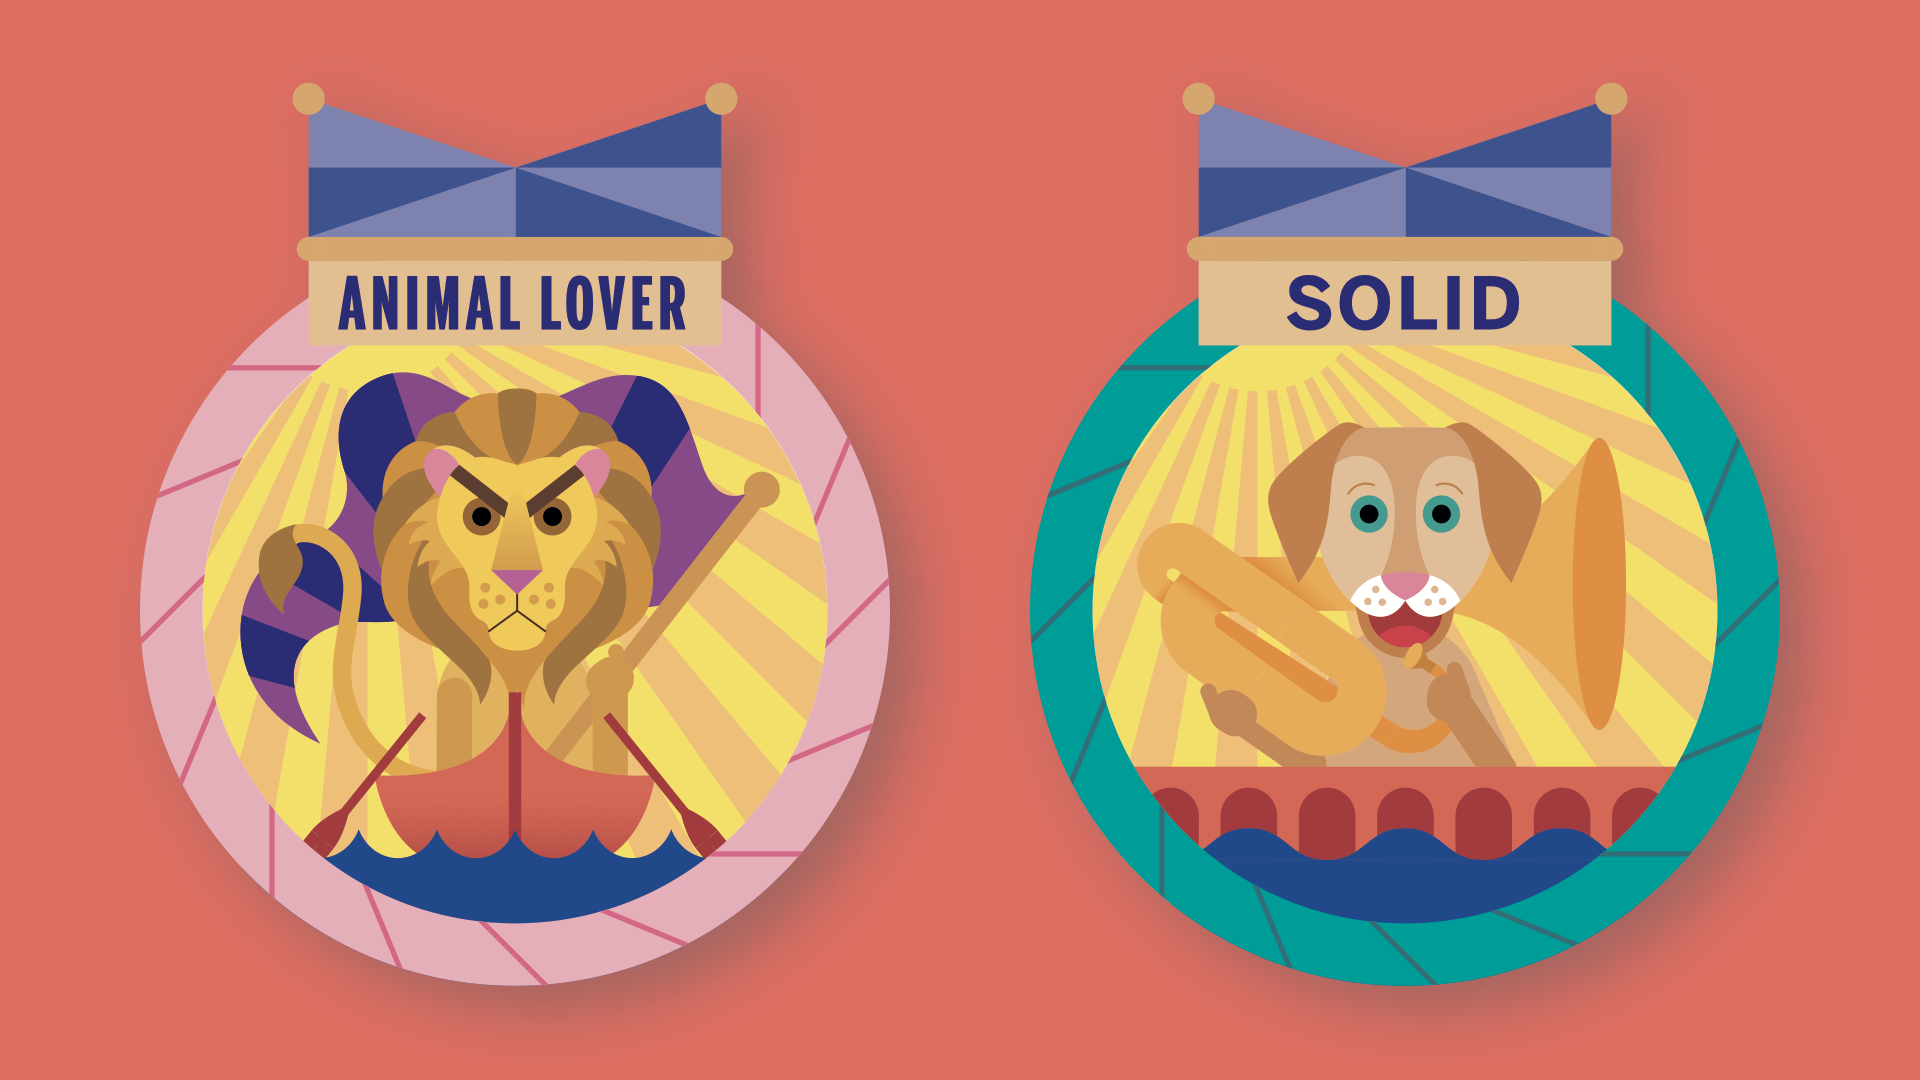
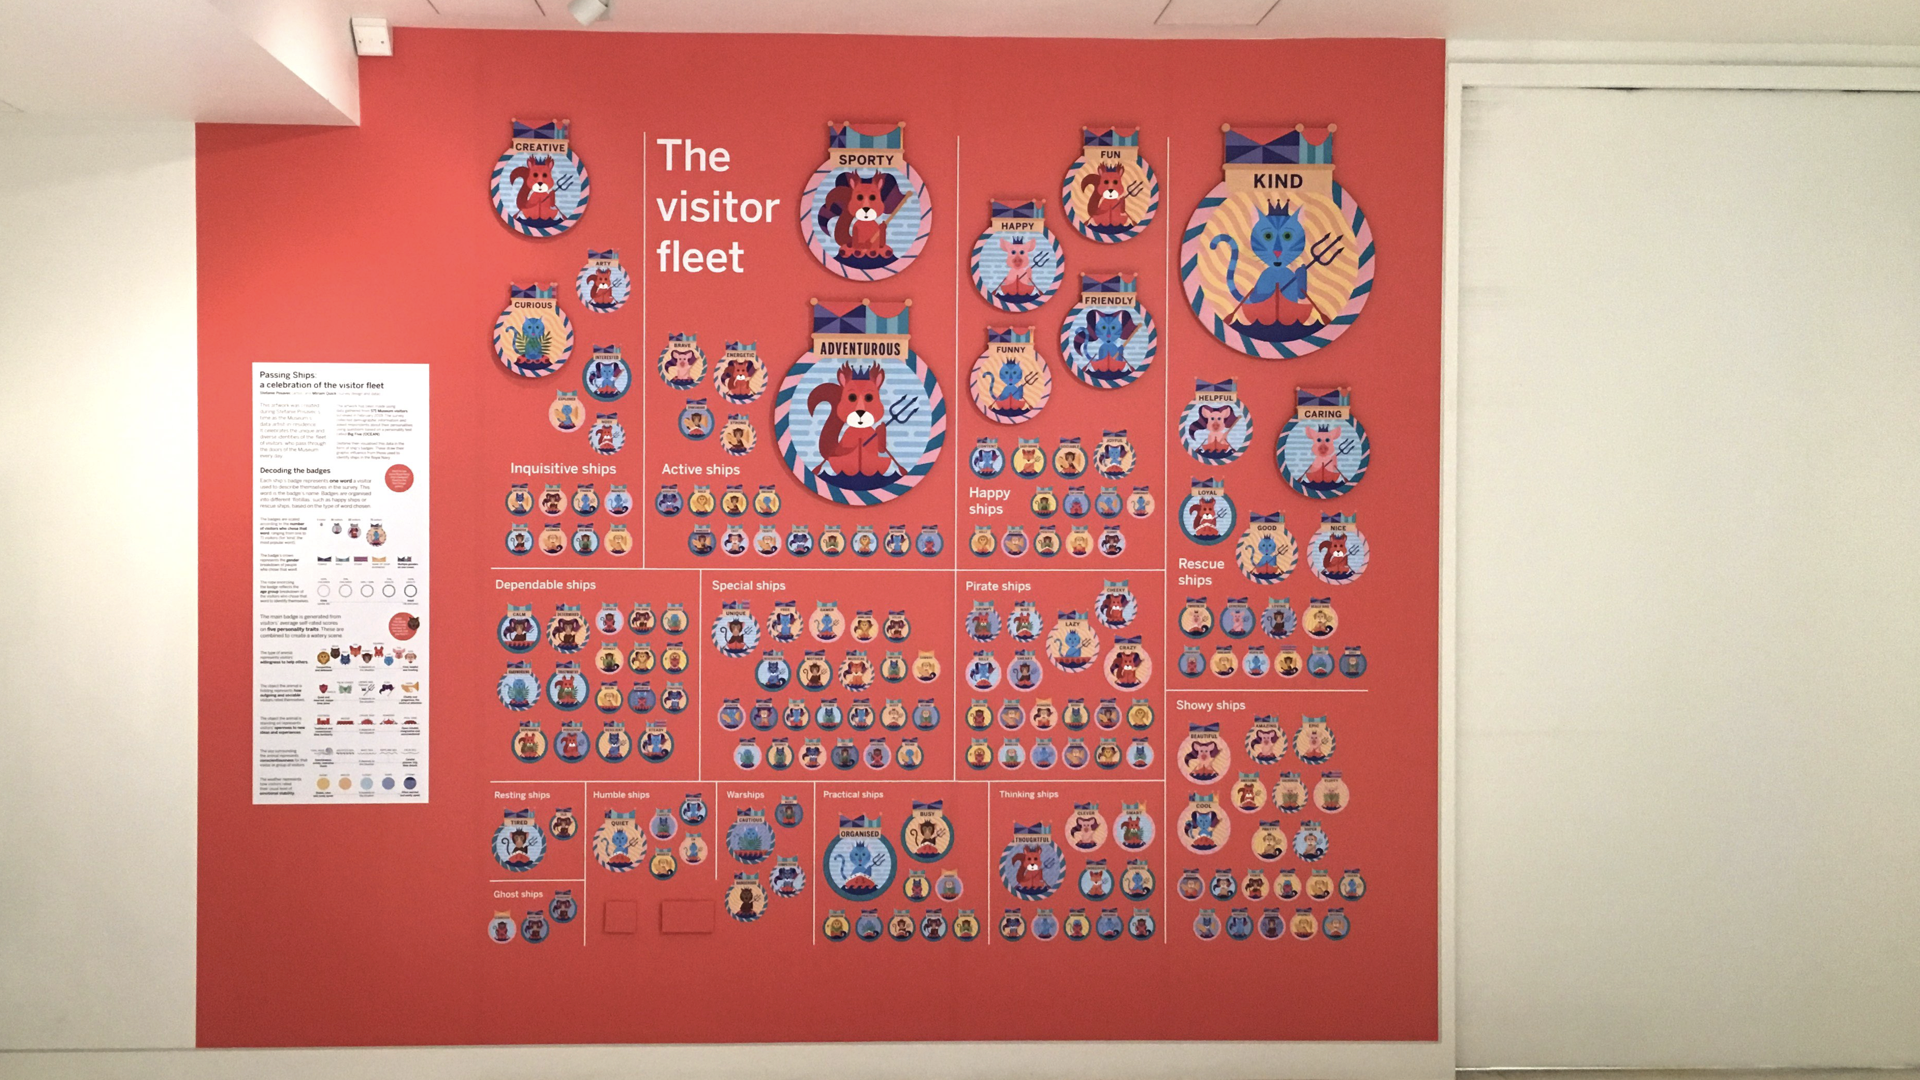
While observing Museum visitors, I began to see them as a fleet of ships, where each visitor ‘ship’ brought their unique personality as their cargo into the Museum, so I decided for my end artwork that they should be commemorated with their own ship’s badge made from their personal data.

Royal Navy ships badges (collection of National Maritime Museum)
Creating a data collection experience
To collect enough data to create the final artwork, I needed to create a meaningful data collection experience that would appeal to visitors of all ages and be thankful of their data contribution.
My data collaborator Miriam Quick created surveys appropriate for children and adults that collected a mixture of basic demographic data as well as questions about their personalities, and also asked which single word they would use to describe themselves.
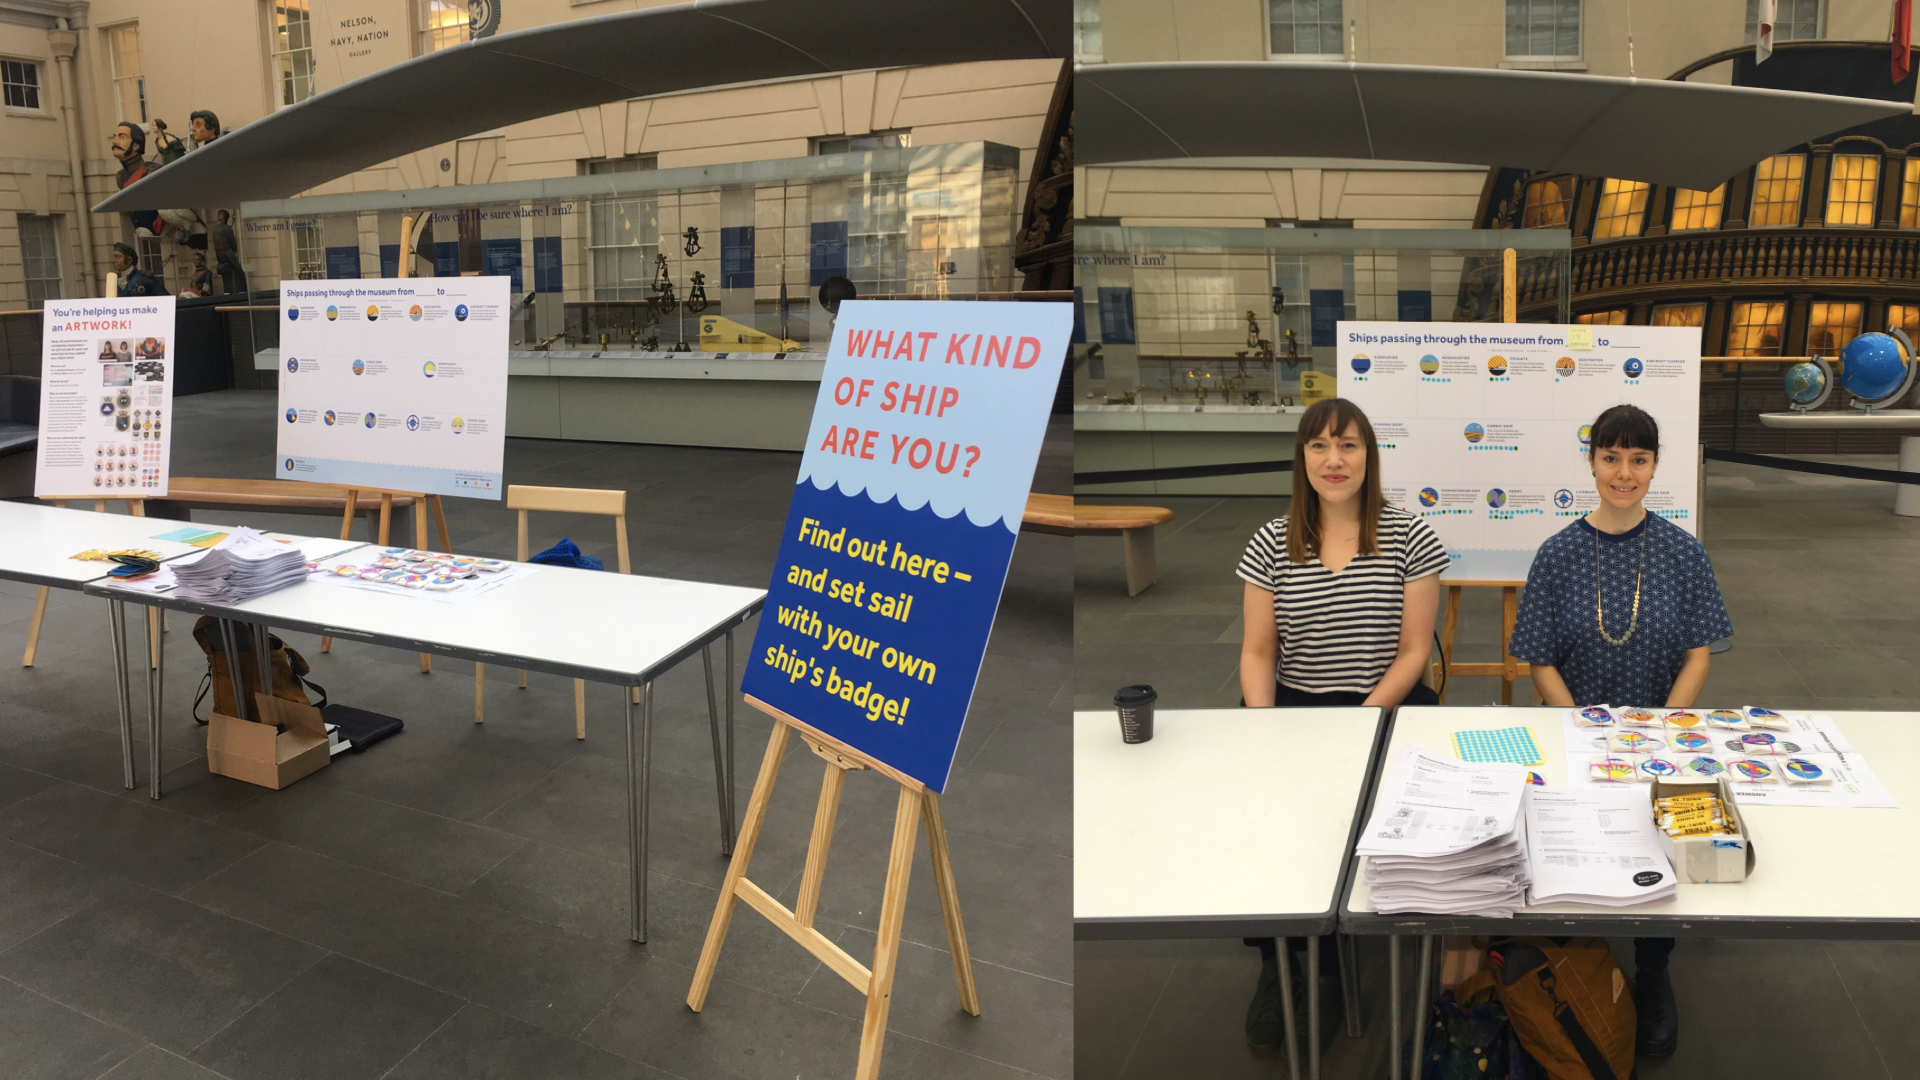
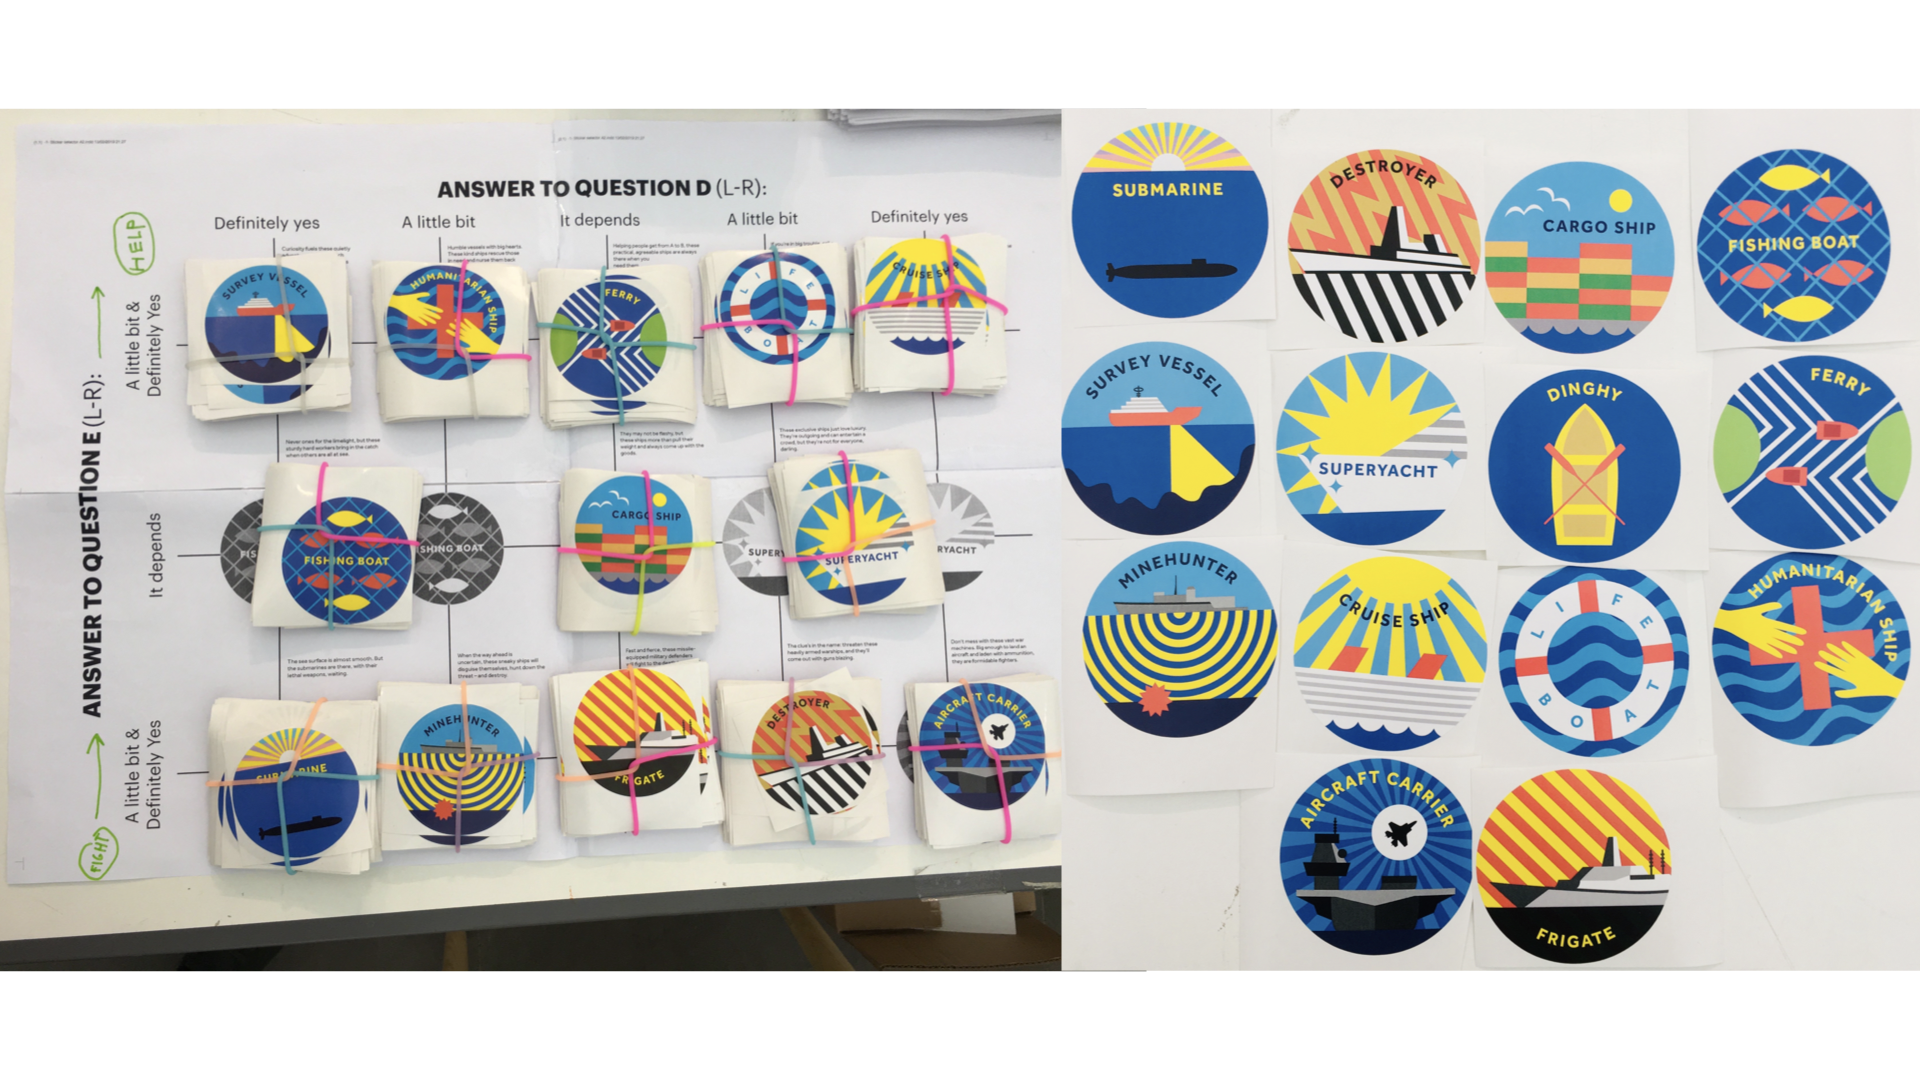
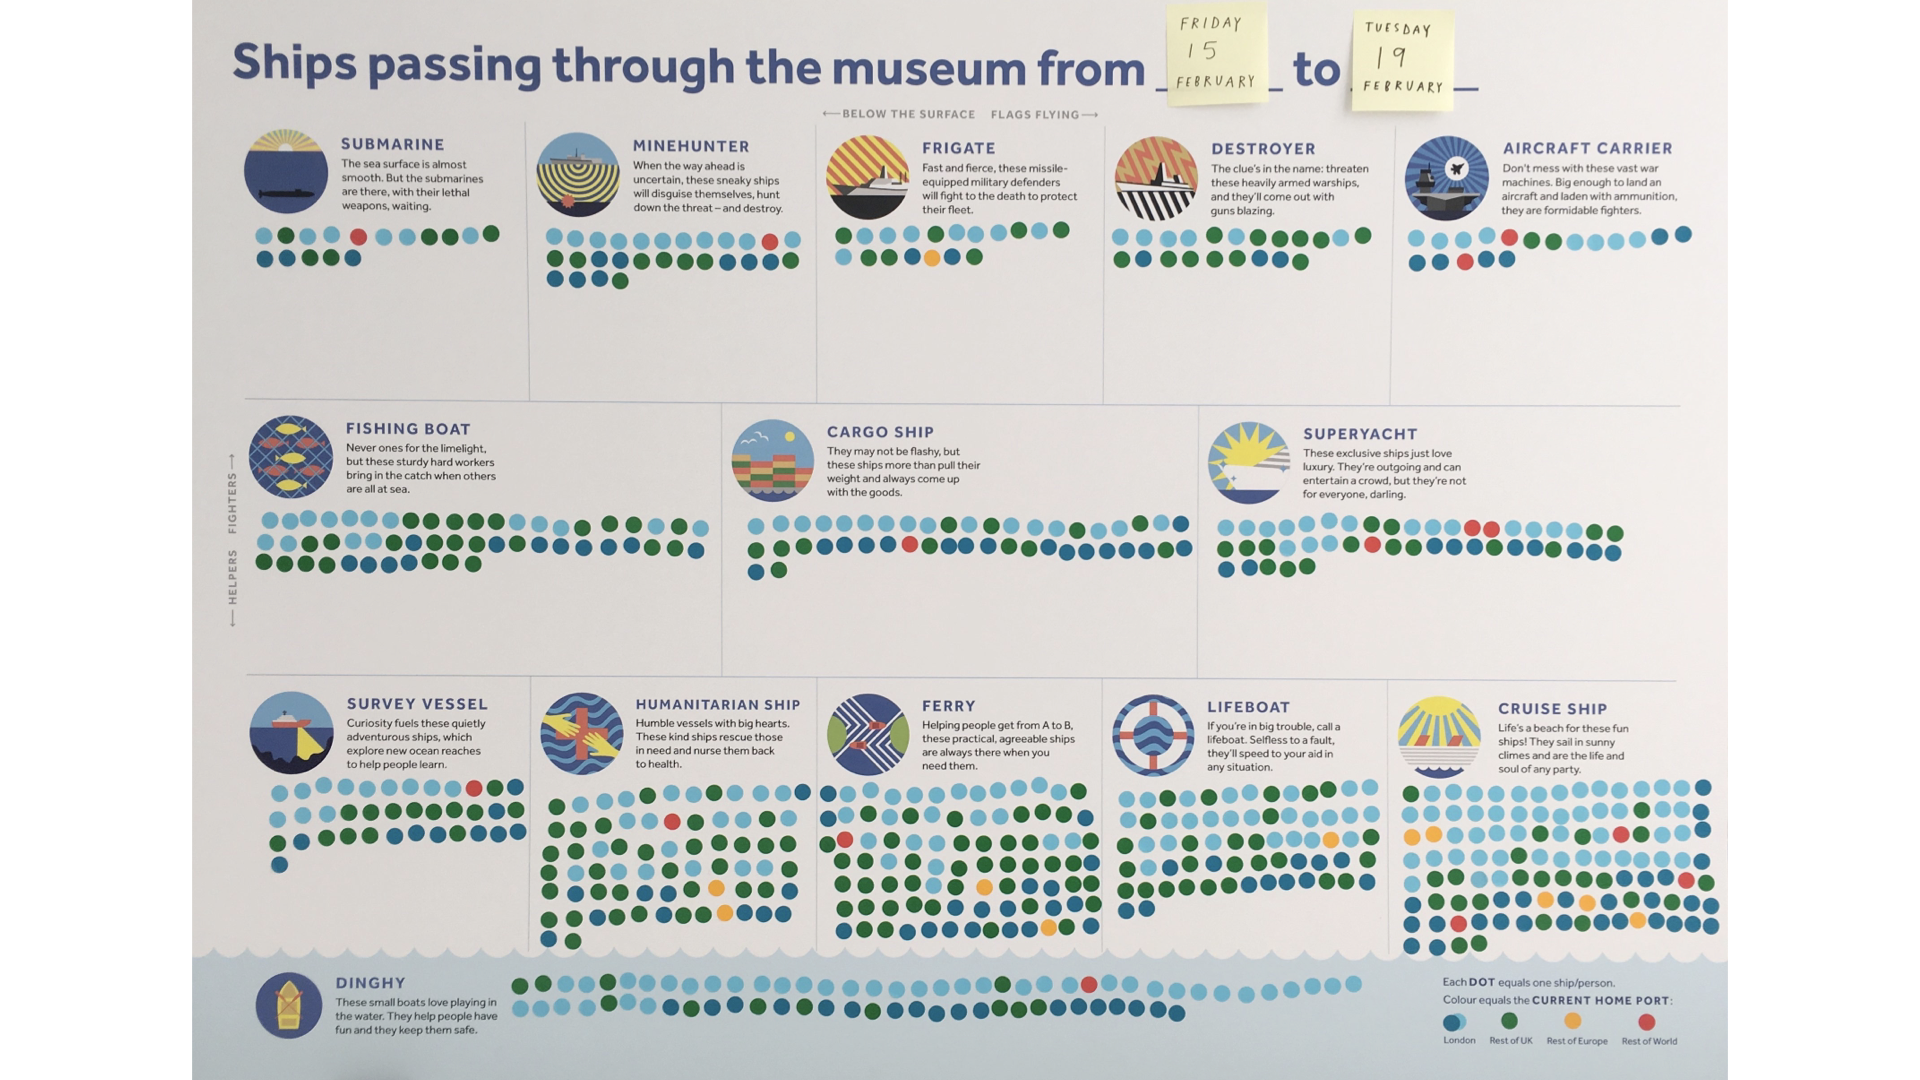
The two of us collected data over five days through setting up a stall where we invited people to take our survey and then learn what ship they would be based on their personality. The survey took a few minutes to fill out, and when completed we would use a very lo-fi decoding tool to assess their survey responses, determine which ship they would be and then we’d give them a giant literal ship ‘badge’ sticker I designed of that ship. Finally, we gave participants further context through displaying a tally board showing how many of each ship type took the survey.
At the end of the data collection, we ended up with 600 survey responses to work with.

Initial design sketches
With the data in hand, I now needed to create an artwork that spoke to the audience I collected data from: children, parents, and newcomers to data, so I decided to move away from abstracted data as it didn’t feel right for this skewing younger all-ages audience, and instead moved towards a more playful approach.
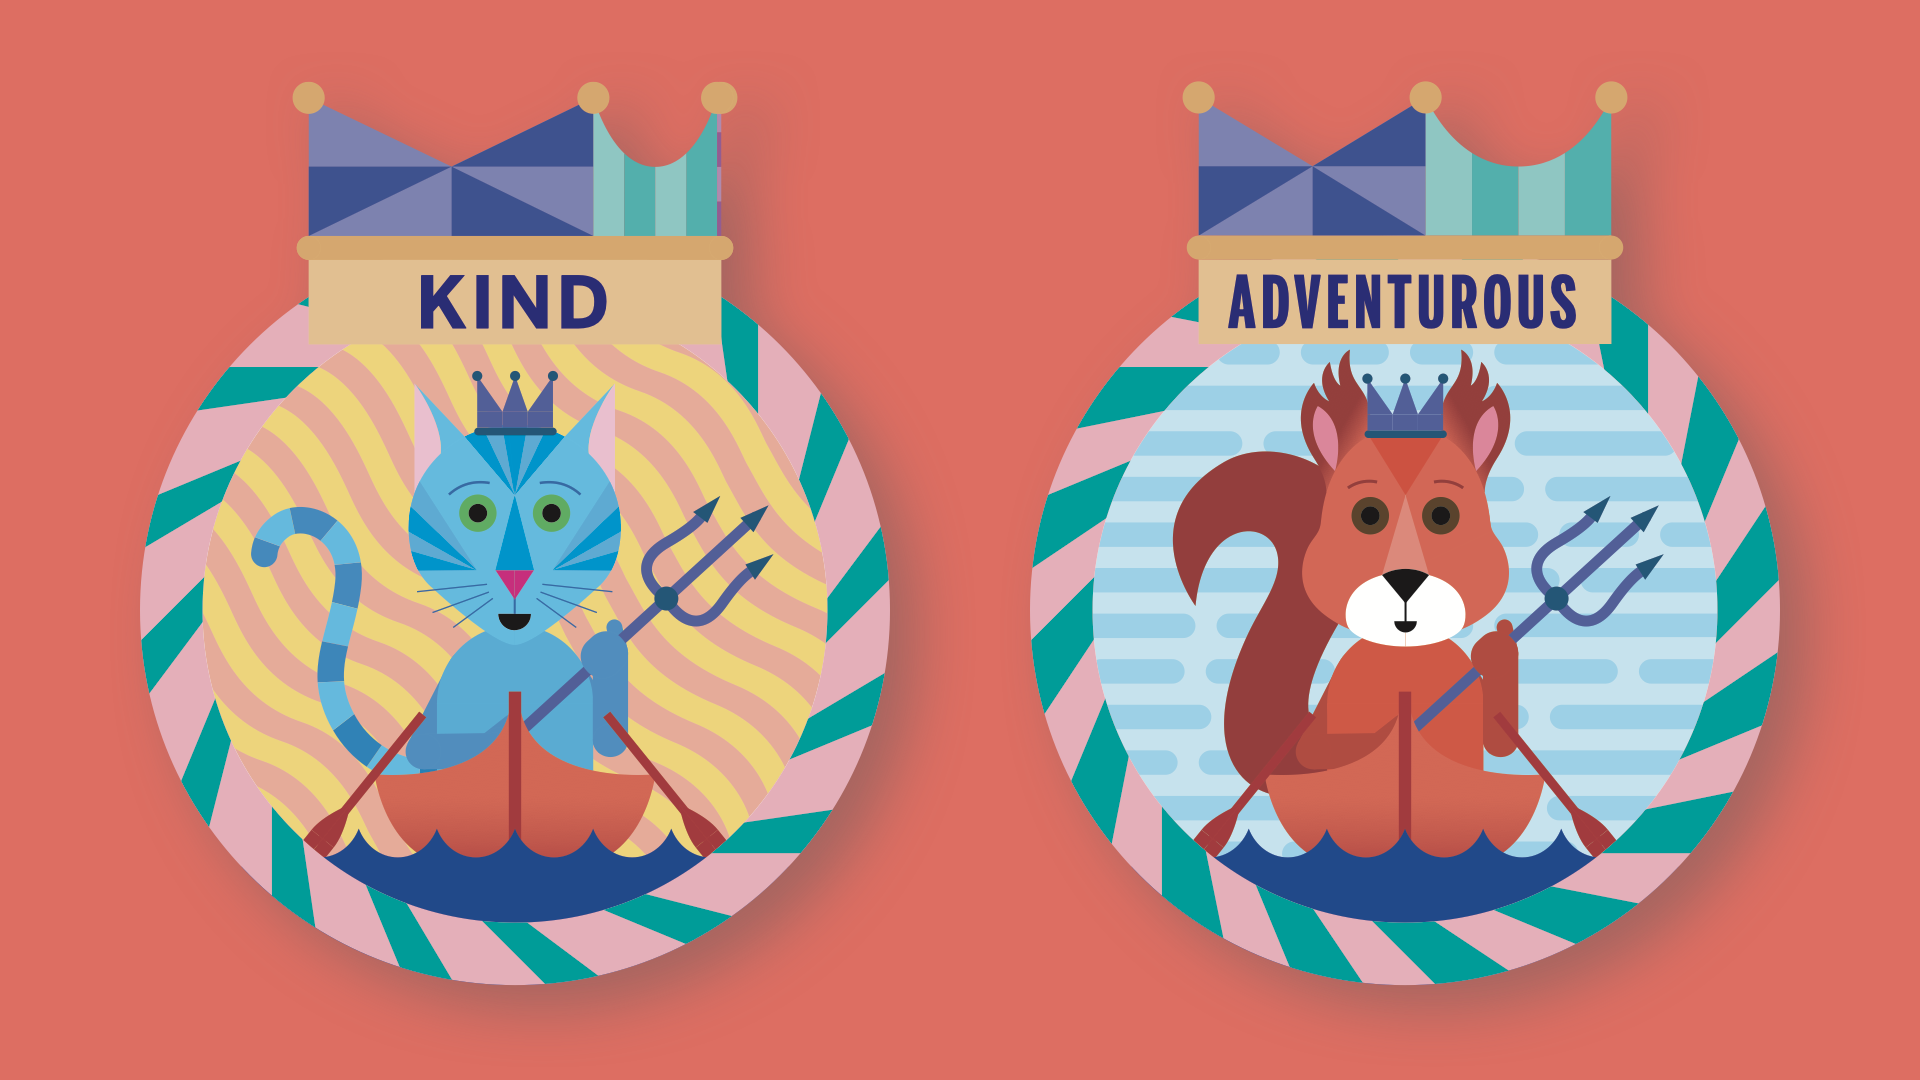
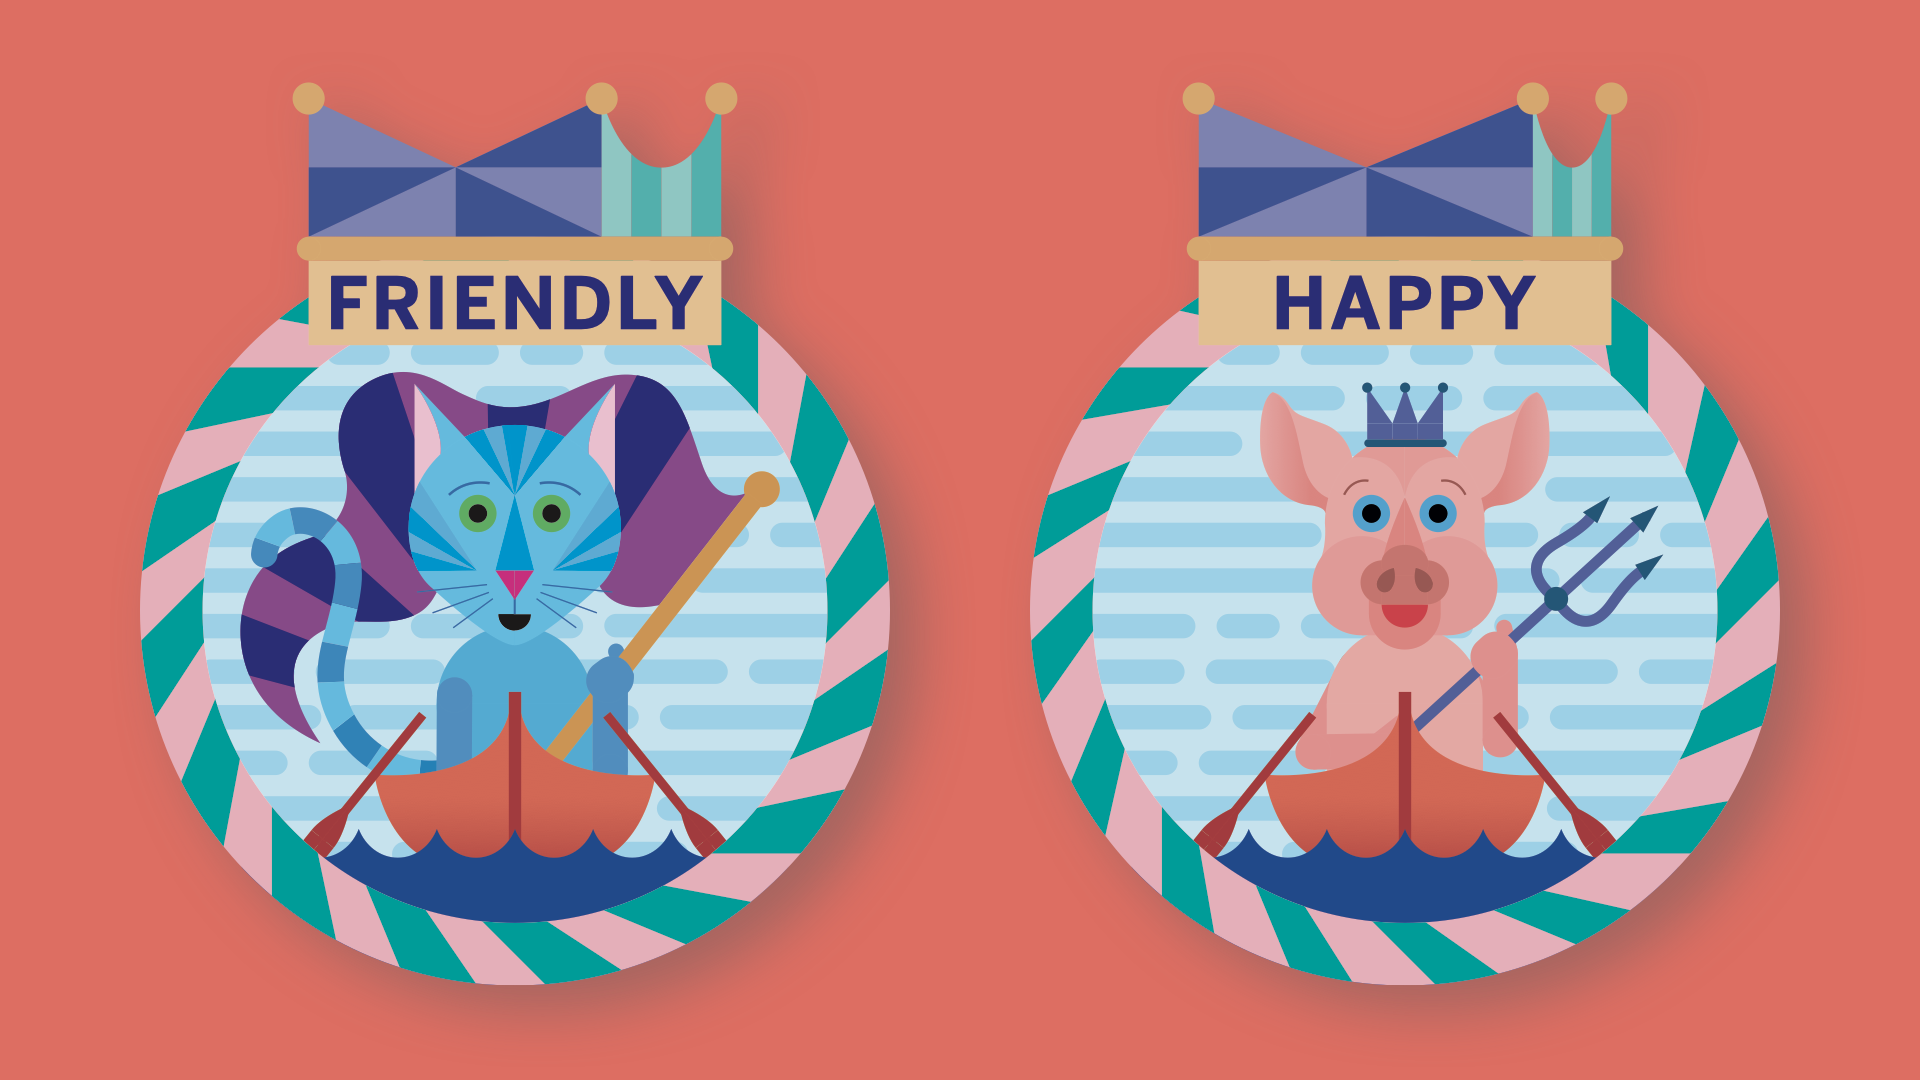
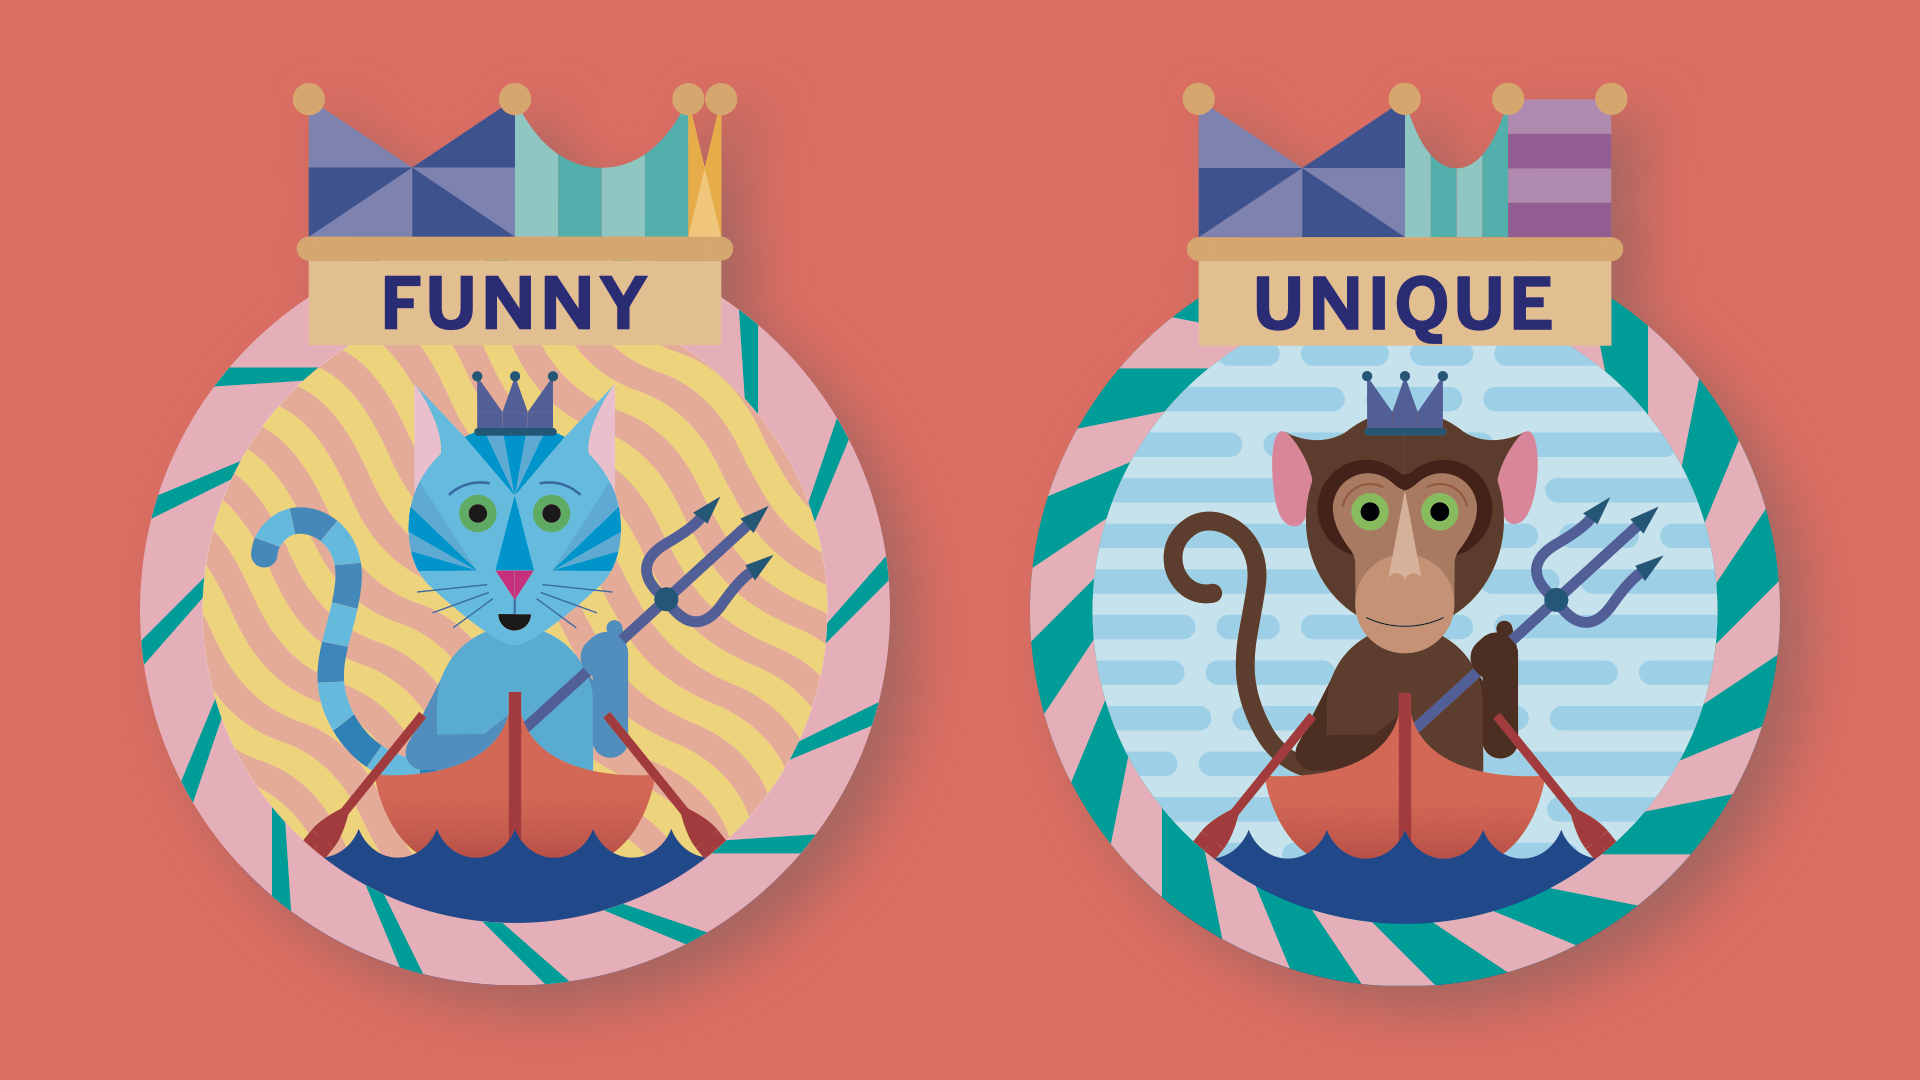
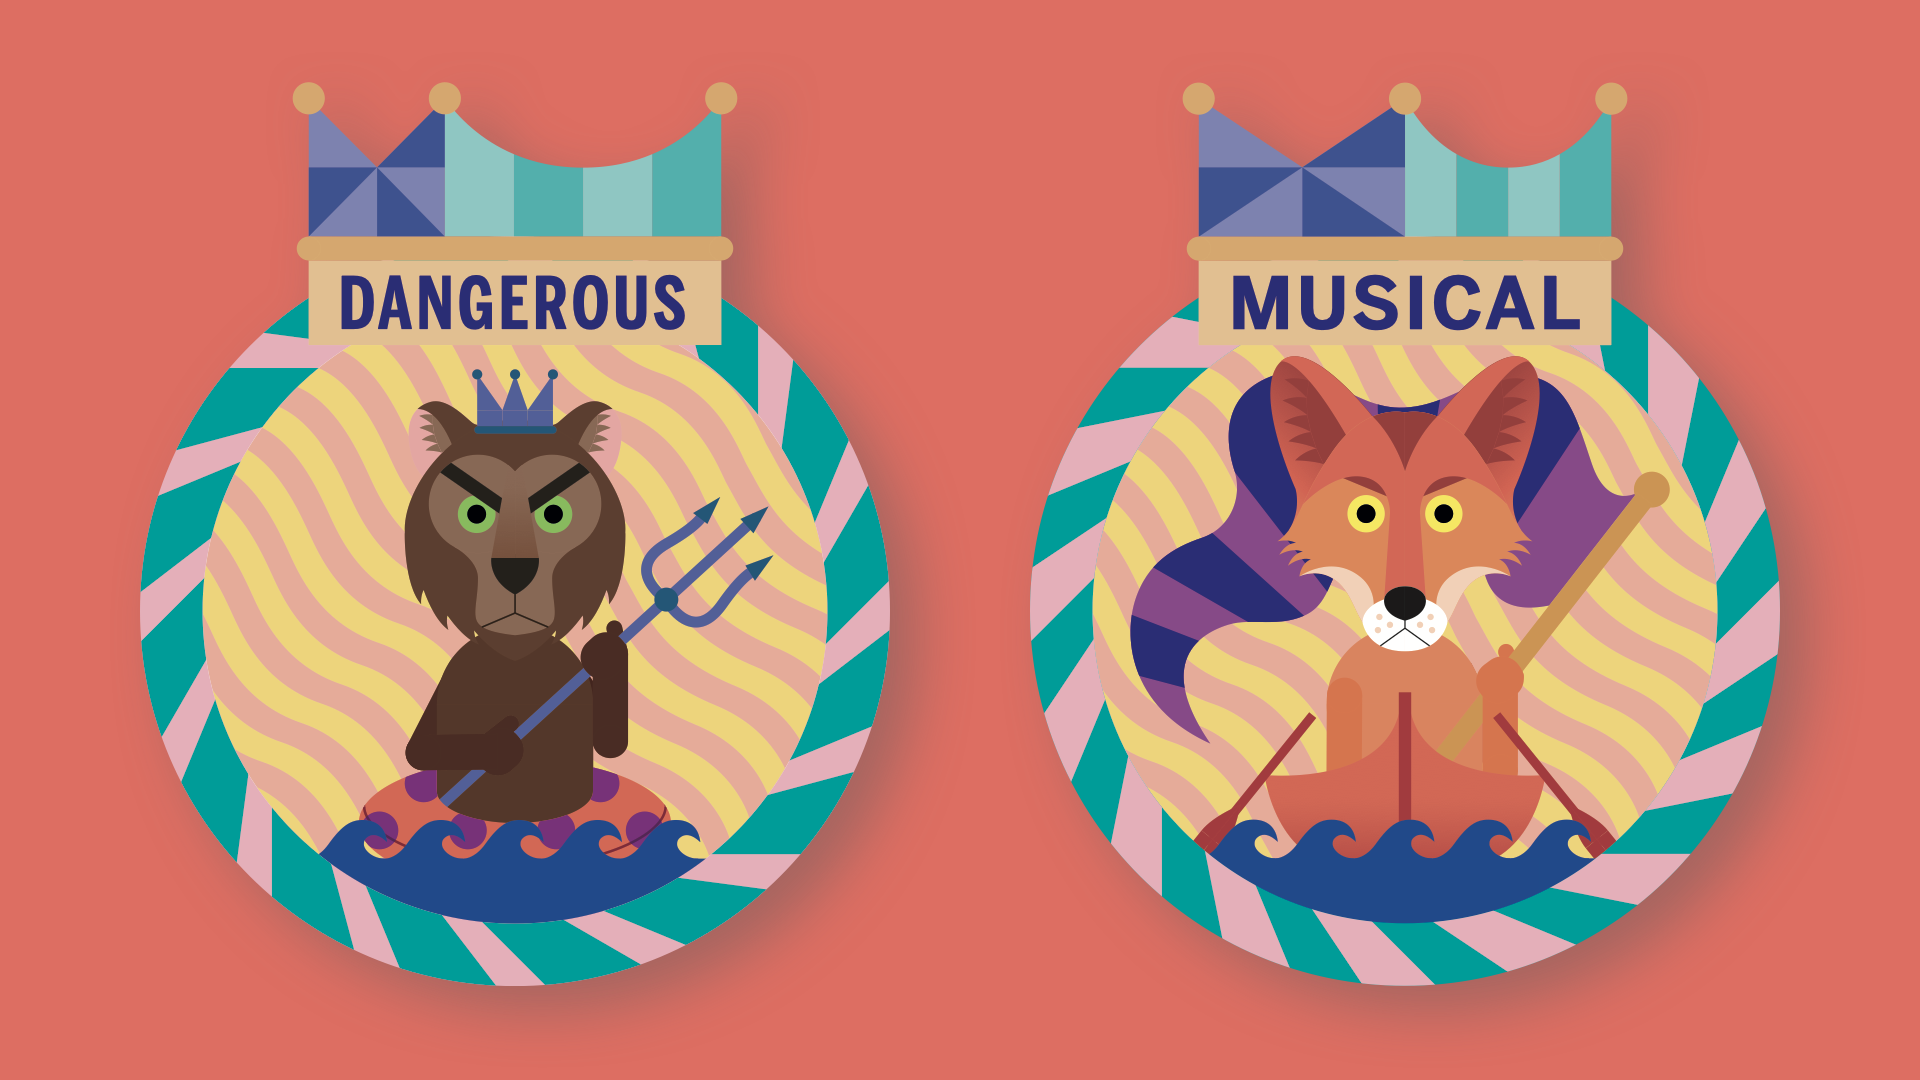
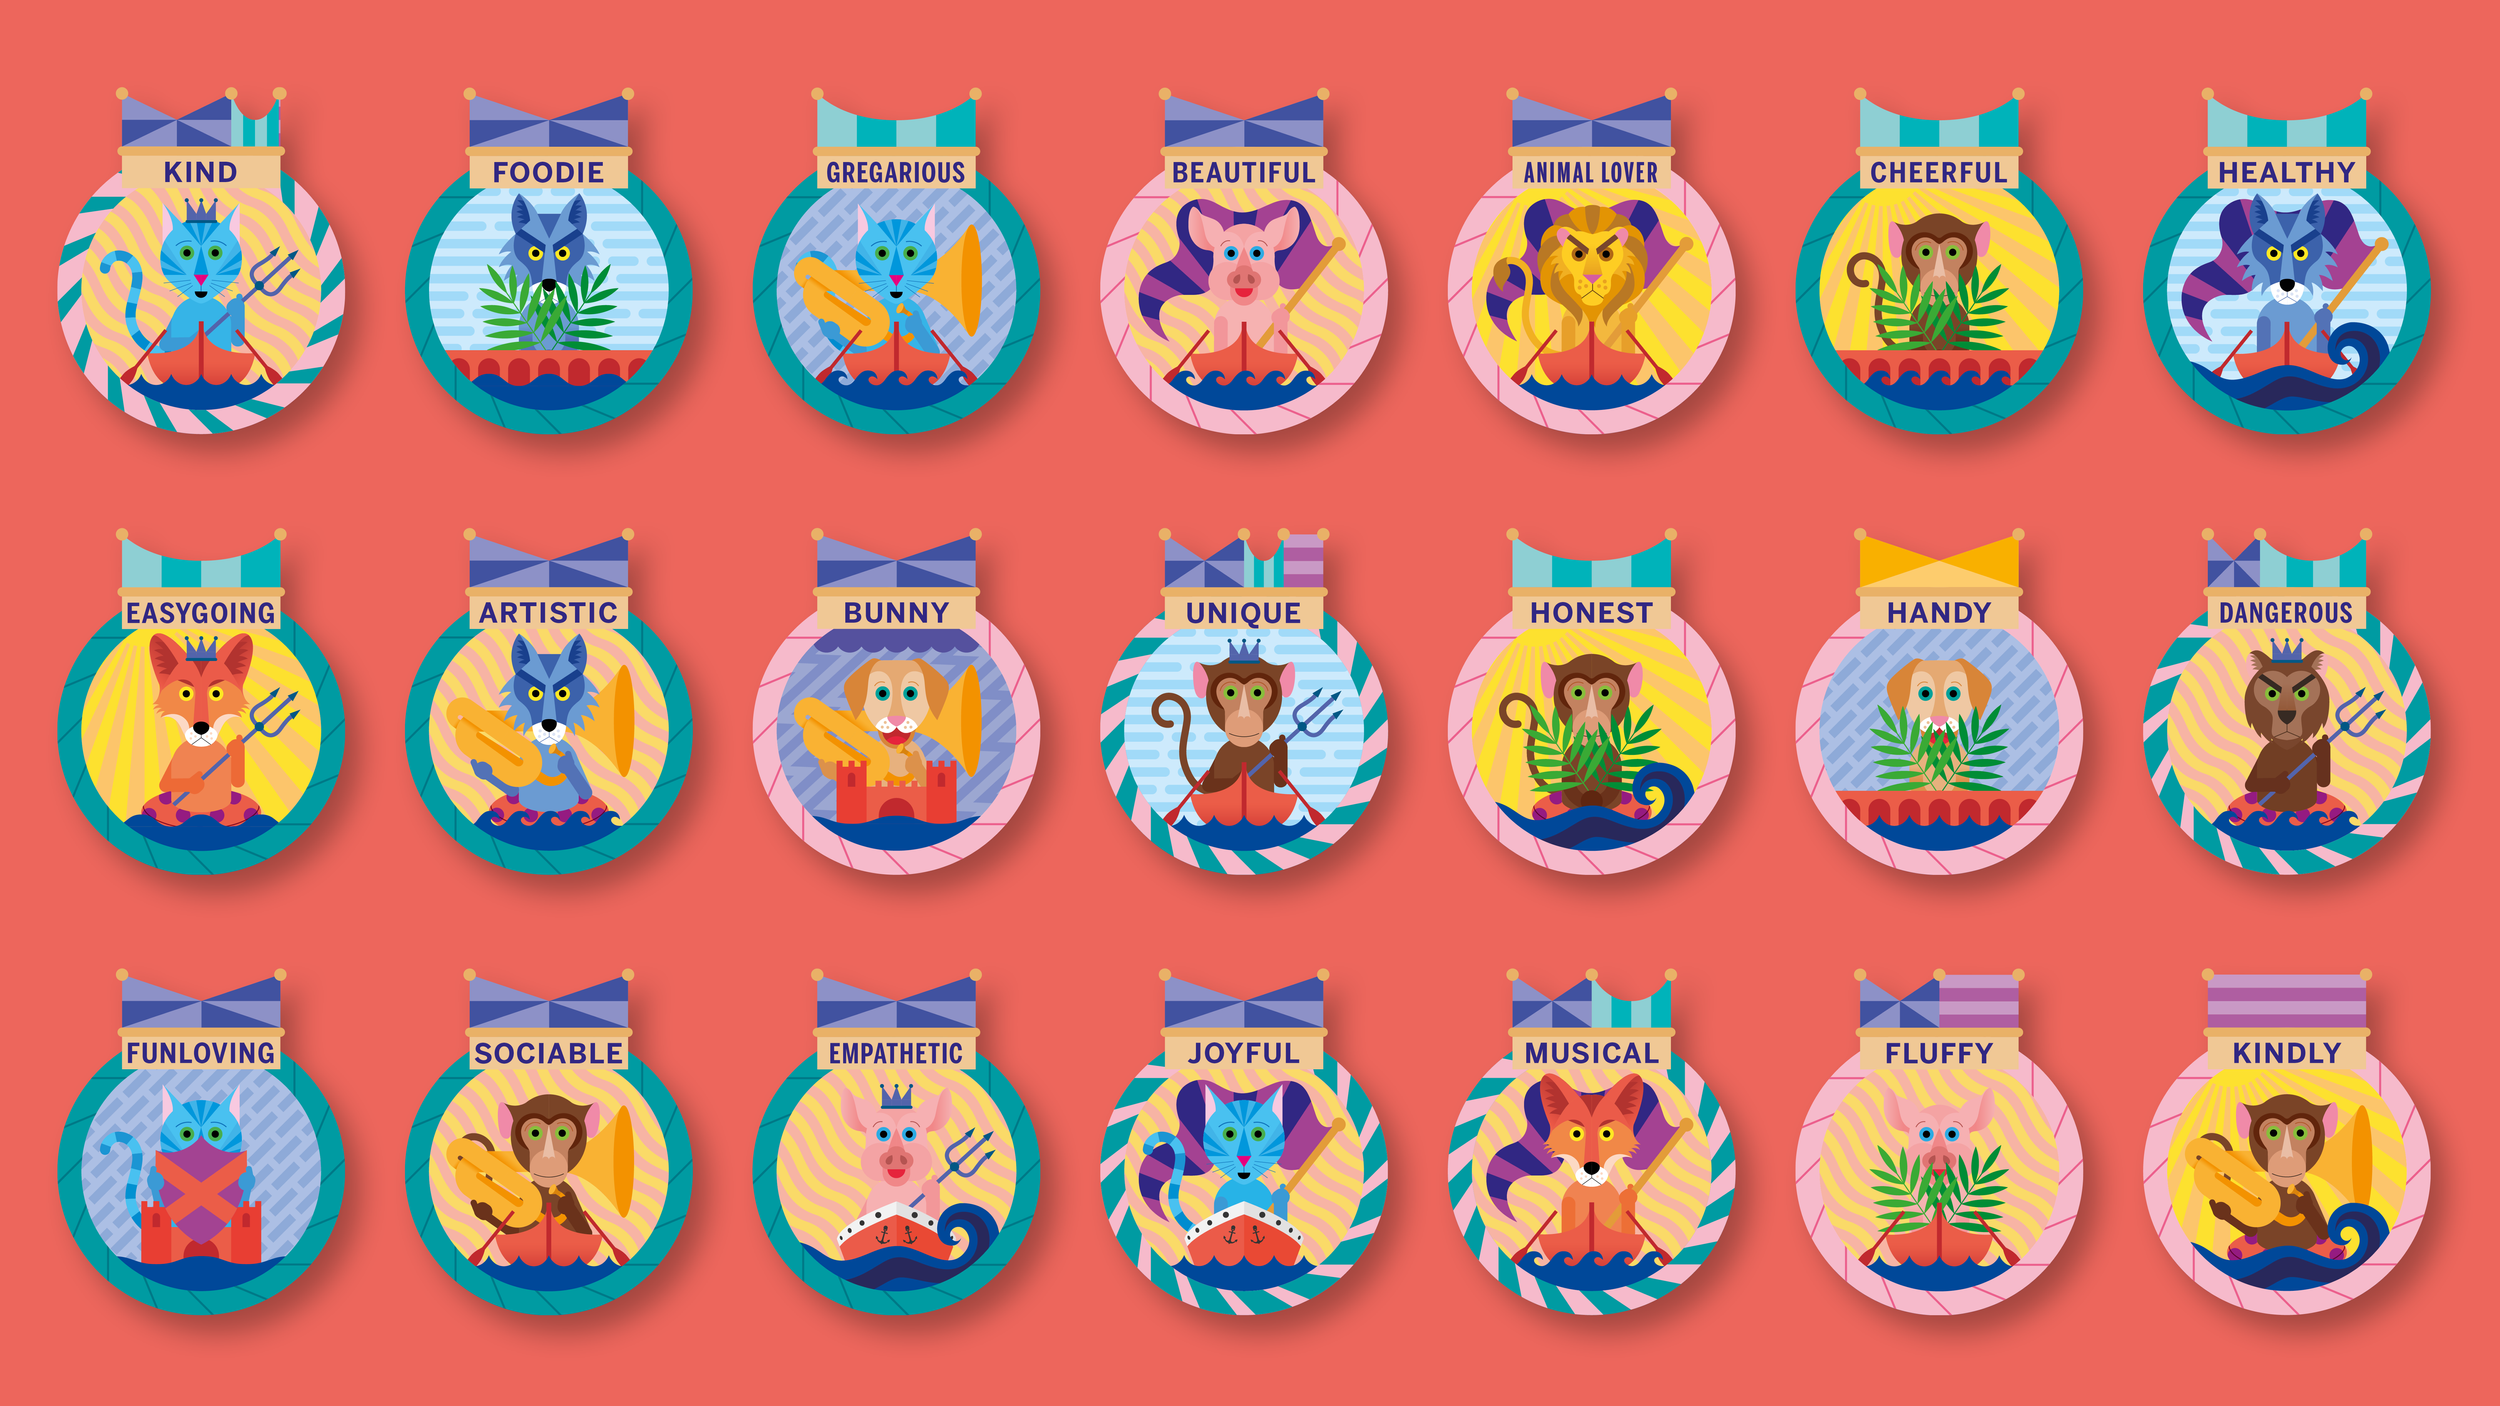
I made first sketches, where every word used by visitors to describe themselves is one badge, where demographic data would inform the external ‘frame’ of the badge and the internal watery scene would be created from visitor’s personality scores.
And in this scene the five facets of the personality test where visualised by the chosen animal and what they were holding, what they were sitting in, and the weather and sea behind them, where every element has a reason, and every one of the 177 ships’ badges created were unique.

Graphic elements used to represent personality survey answers